If you have thoughts, comments, questions: comment below or email me at chris(at)vintality.ca
Table of Contents
But hey, don’t those maps look pretty!
What is an electrical conductivity (EC) map?
An EC (or electromagnetic (EM)) survey is a measure of electrical conductivity. An EC map, put simply, is just the measure of the electrical conductivity within the local environment (soil, fencing, etc). The EC map is just showing the areas that conduct electricity at a high rate (in pink) and low (in dark blue).
There are three metrics that normally affect soil conductivity: moisture (water content), texture (clay content), and salinity. These are very inter-related, as we know higher clay content will lead to increased water retention. More water, clay and salt will lead to higher electrical conductivity while drier, sandier soil will have low conductivity.
There are more environmental factors than just moisture, texture and salinity (more on this later) which affect soil conductivity. For example, metal conducts electricity at a very high rate and thus metal trellising and fencing will affect the EC readings. In our experience its around 5 feet of row spacing when the EC survey gets dicey because of the interference of metal trellising along vineyard rows. Funny enough, because I have metal in my leg from a car accident I can’t do walking EC surveys as we’ve found it creates too much interference on the readings.
This is important: the EC map is not telling you the absolute soil conductivity values but relative values within the specific vineyard. Let me give you an example: when you’re doing soil sampling if you get 2 ppm for nitrogen you know that’s a low number. This does not work for EC surveying: if you get a “2” it doesn’t mean anything – you’re never looking at the actual numbers but the differences between the numbers within a specific vineyard. This is why “ground truthing” (digging a soil pit or augering) is so important for EC surveying: it’s how you’re calibrating your values to determine why the conductivity is high or low.
We’ll discuss interpretation and ground truthing further down.
How does the EC survey work?
The simple version is that the equipment (usually an EM-38 but sometimes a VERIS) is generating a primary alternating magnetic field. This field will generate secondary alternating magnetic fields in conductive material (such as water or metal) in the local environment. The strength of these fields within the soil are affected by the conditions discussed above: water, clay, salinity (primarily). The EM-38 is measuring this local field as you move across the soil.
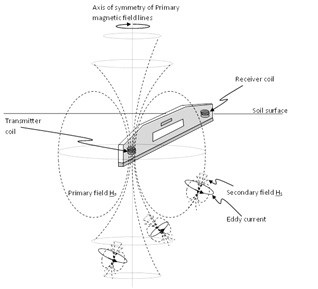
The depth of the reading is determined by the length of coil in the EM instrument. The EM-38 measures to a depth of 1.5m (full coil) and 0.75m (half coil). You can penetrate to much, much greater depths (such as with an EM-31) but a max depth of 1.75m is appropriate for most vineyard applications.
It is important to note that EM-38 is reading to a depth of 1.5m not at that depth. So when you see an EM map at 1.75m depth it is not a cross-section at precisely that depth – it is an average from 0.0 to 1.5m. So if you have a lot of clay content higher up in the soil profile (say around 0.5m), this will average up the 1.5 m reading. This is also why its absolutely necessary that you measure at a couple of different depths (normally 0.75m and 1.5m). This allows us to compare values at both depths and better understand what’s going on. If there is a clay body at 0.5m, it will show up much more strongly on the 0.75m reading and less strongly on the 1.5m reading. Thus we compare these maps and determine there is a more conductive body higher up in the soil profile.
When do you do an EC survey?
The scientific literature actually points to two different extremes: at field capacity or at its driest. Because of this, the recommendation is to run an EC survey twice – once during both times. Of course, this is not economically feasible for most vineyards and we don’t believe it’s necessary. The level of precision this approach gives you is not practically useable. So unless you’re planning to irrigate every meter of your vineyard differently you’ll get more than enough quality from a single survey.
Ok, so when do you want to run an EC survey?
Realistically, you can survey when the vineyard is at water holding capacity or at its driest. A big reason is because we always recommend ground truthing the results (more on that later) – this is a must. Because we’re verifying our results with what we physically see in the soil profile we can calibrate a single survey to get very accurate results.
Our preference is to run the survey when the soil is at its driest purely based on our interpretation of the literature and best practices. But again, this is only a slight preference and you will get great results either time of year. Often a decision for a vineyard will be which time of year is practical to accommodate a survey and do the ground truthing.
How do you do an EC survey?
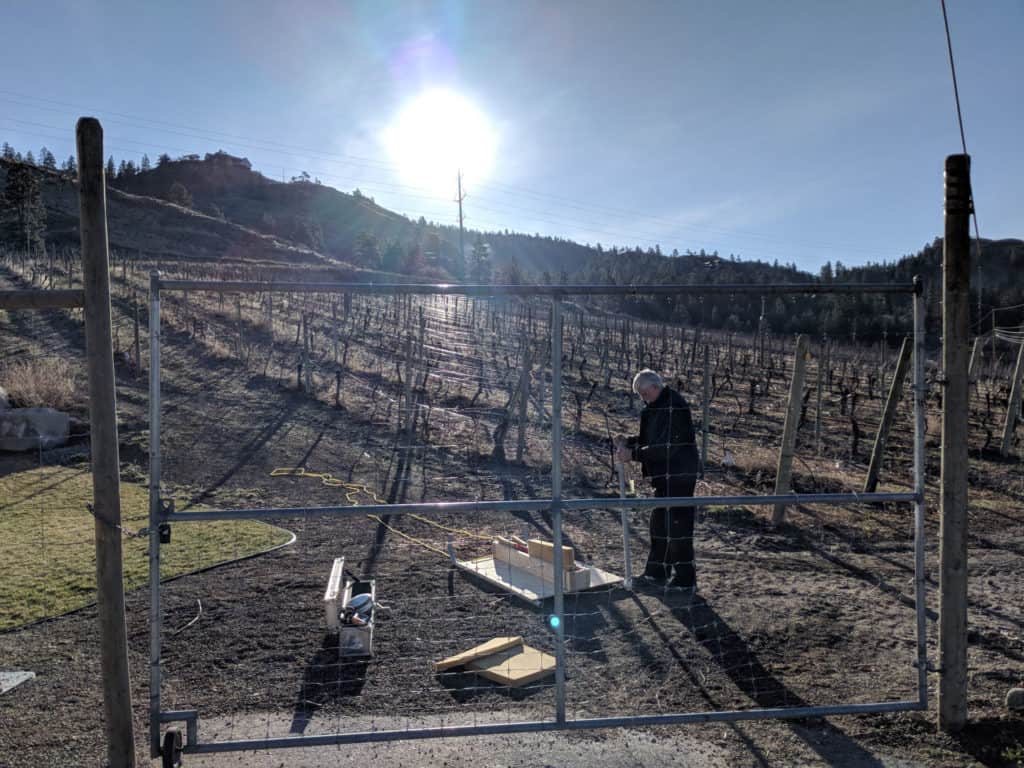
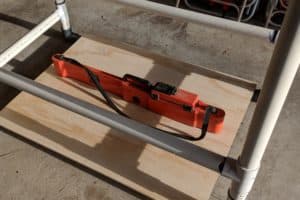
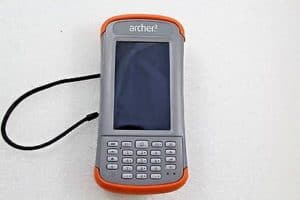
The first thing is the equipment: a Geonics EM-38, a GPS, and a data logger. It’s possible to do the survey on foot on smaller vineyards but on larger vineyards you’re dragging a sled (with EM-38 attached) behind an ATV. Two things are very important: the sled is far enough back from the ATV and the sled has zero metal on it. This makes building sleds very challenging as they can only be built of non-conductive materials (primarily wood and plastic). In large agricultural fields you can often get away with wooden boxes or rubber mats but this doesn’t work in vineyards for two reasons: first the ground is usually rougher in the middle and humped, second because it’s imperative you keep the sled in the middle of the row to minimize interference from metal trellising.

When you start the survey, there are important things you must do like calibrate the EM-38 to the local magnetic field. Once that’s done, its time to run the survey. If driving an ATV, don’t move faster than 10 km/hr.
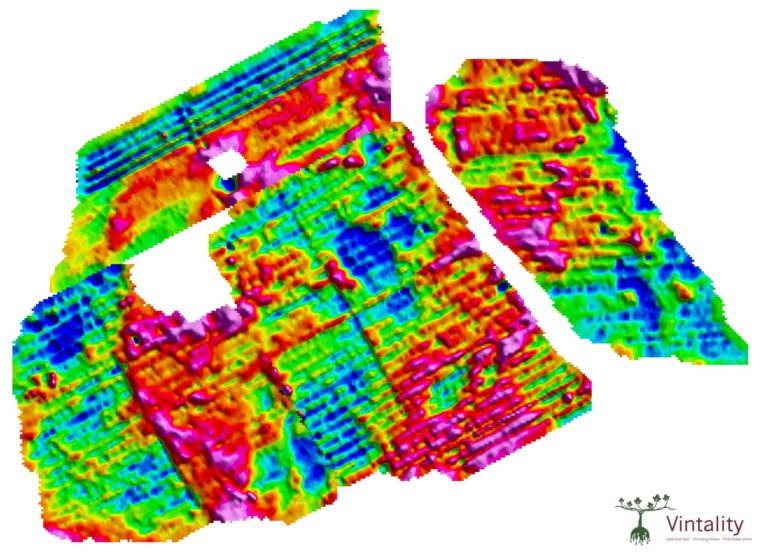
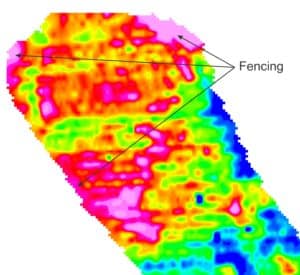
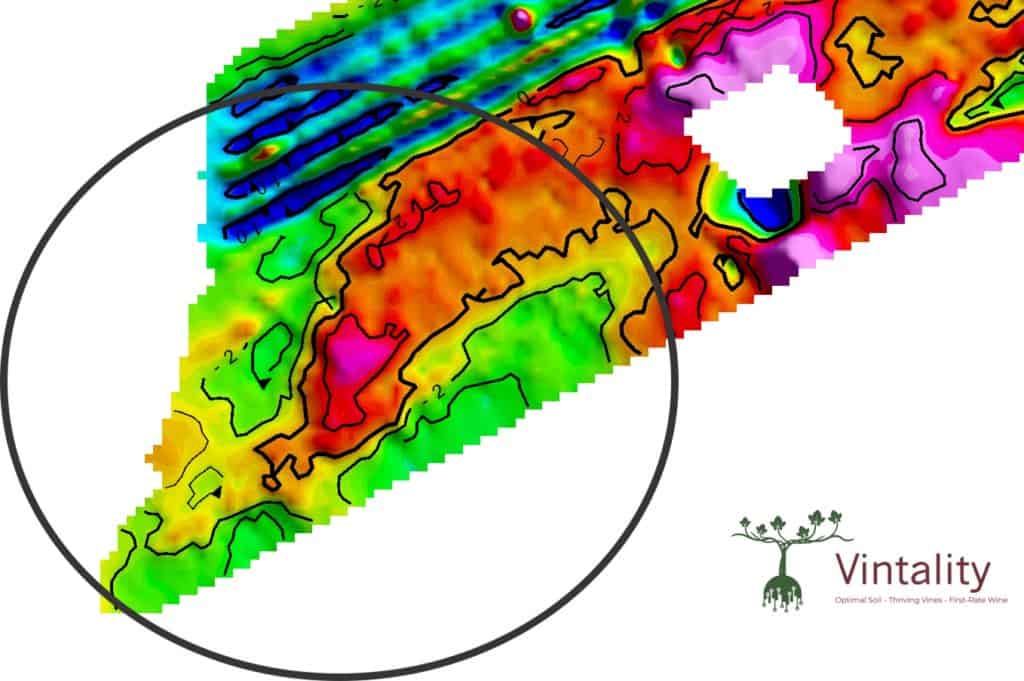
Once the survey is done, there’s still lots of data clean-up and analysis that needs to be done before it’s presented to a vineyard. For example, there’s often metal fencing around the edges of vineyards which you need to (sometimes laboriously) remove from the raw data (visible in the image below). Once that’s done, you’ll use a program to perform a geostatistical technique called “kriging” (there are other techniques but this is a well supported one). This is what produces the first draft of colored map.
From here it’s about tweaking, adding the right elements, and putting together something that is easily interpretable and communicates as accurately as possible what’s going on within the soil.
How do you interpret an EC map?
First, when looking at an EC map you must remember we’re not interested in absolute values. Highs and lows are relative within the vineyard. The highest high on a sandy vineyard could be the lowest low on clay.
Second, we (and you) already have information from the vineyard and will correlate this with features in the map. For example, you normally can eliminate salinity as a factor. Saline soil will typically be an issue only with vineyards that are in very dry climates with little rainfall (as rainfall quickly washes the excess salt out of the root zone). Thus we’re coming in assuming that water (either directly or due to clay) is a driving factor. We’ll also use any information the vineyard has on its soil, even purely visual observations like X area being sandy and Y area really holding water.
Third, we’ll correlate with other surveying done in the vineyard. If we’ve done our bioavailability sampling we’ll look for correlations there or with other soil surveys like CEC or organic matter. Any other relevant information the vineyard has we’ll examine to help us tease out correlations and likely causative factors. In the vineyard example we’ve been using, we saw strong correlations between relatively high CEC and conductive highs indicating that clay (and thus water) was a major determinant. I want to re-emphasize that we’re looking at relative values within the vineyard – this vineyard did not have a lot of clay but the areas that were higher in clay were more conductive.
In the example below, we see very high correlation between CEC readings and EC highs and lows. The EC highs (pinks) and lows (blues) match up very strongly with the CEC readings. This immediately tells us that the clay content of the soil is a driving factor in the relative conductivity of the soil. This does not mean the soil is “clay”, simply that higher clay content (and thus water holding) is correlated with high EC readings.
Fourth, one of the first things we look for is differences in highs/lows between the soil depths (0.75m and 1.5m). This usually indicates transition points between soil types and will be a prime target of further investigation. For example, a low at 0.75m and a high at 1.5m would indicate a sandy soil (above) transitioning to a clay soil (at depth). There can be other explanations, such as anthropomorphic interference (eg. buried metal) or a consistent soil profile but with more water at depth (for example, the roots are shallow and haven’t accessed the deeper water).
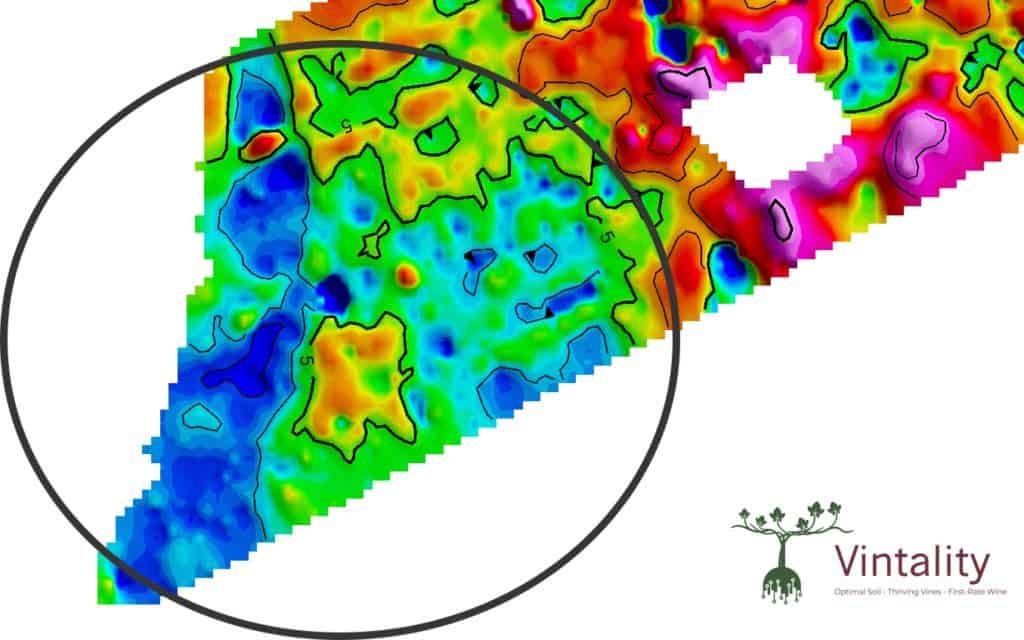
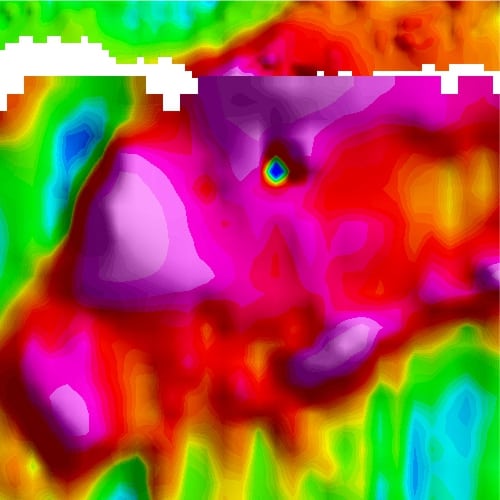
In the example below, we see that at the shallower depth (0.75m) we have a conductivity low in contrast to more average values at a deeper depth (1.5m). This means that there is less conductive material higher up in the soil profile. This area is ripe for ground truthing because of this transition. If you were with us at Blasted Church, this was one of the pits we visited with “beach sand”. Because the soil profile was consistent the differences in conductivity was due to higher water content at depth (due to a combination of it being at the bottom of the slope and the roots not having penetrated to a deep enough depth).
Fifth, we’ll look at any topographical features. Water flows downhill (so I’m told) thus we’ll expect to see relative EC highs in topographical low points. Further, has there been any significant grading, digging or other drastic interventions? This can affect soil structure and thus EC readings.
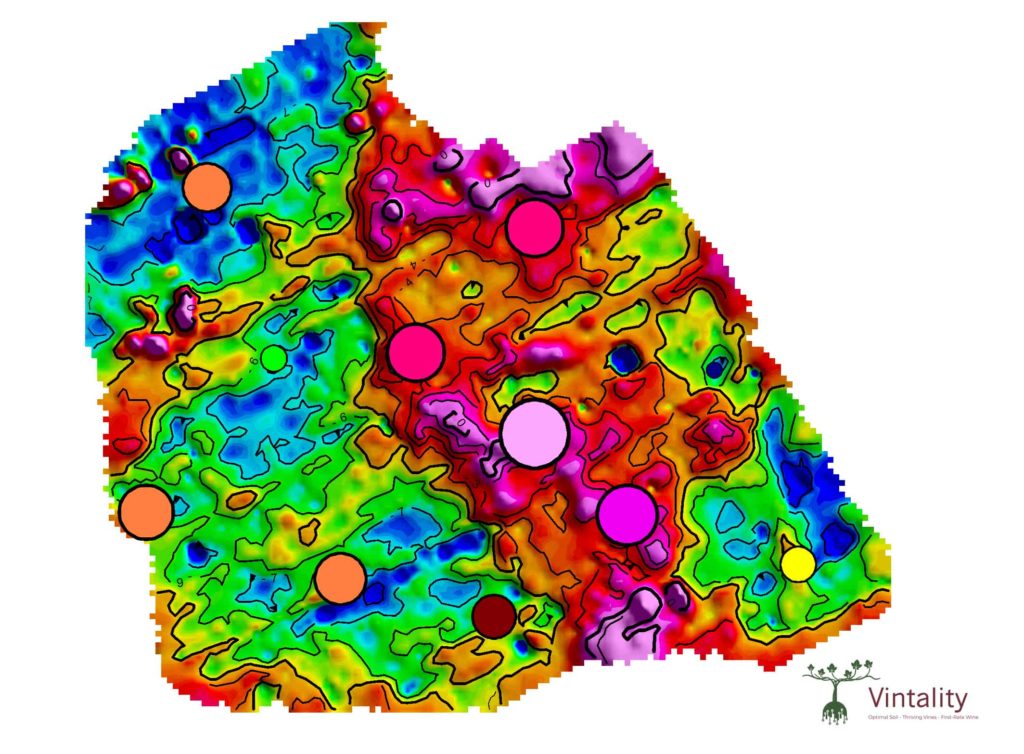
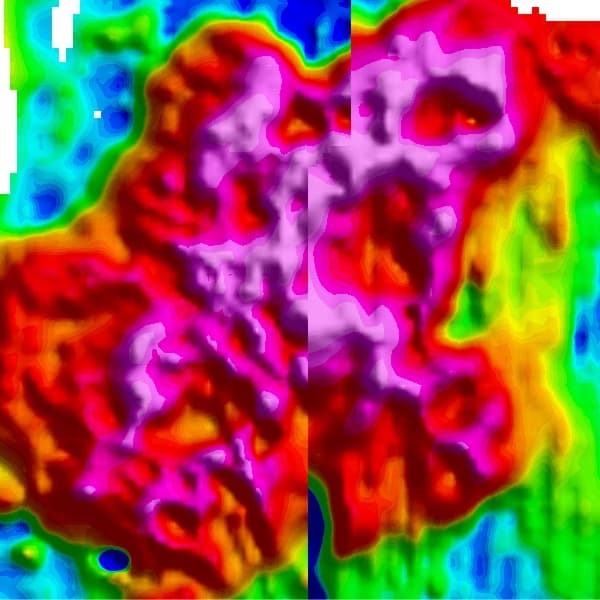
Sixth, we’ll look for distinctive features within the survey grid itself. In the example below we see two conductive highs with very different appearances. The upper conductive high has a mottled appearance while the lower area is smooth. Based on discussions with the viticulturalist, even before ground truthing we know the upper area is due to a more clay soil and the lower area over a graded area holding more water. Thus, both conductive highs are due to differing soil structures. This type of interpretation is only possible through physical observations of the vineyard, you can’t tell this purely by looking at a map (the mottling/smooth areas could have multiple explanations).
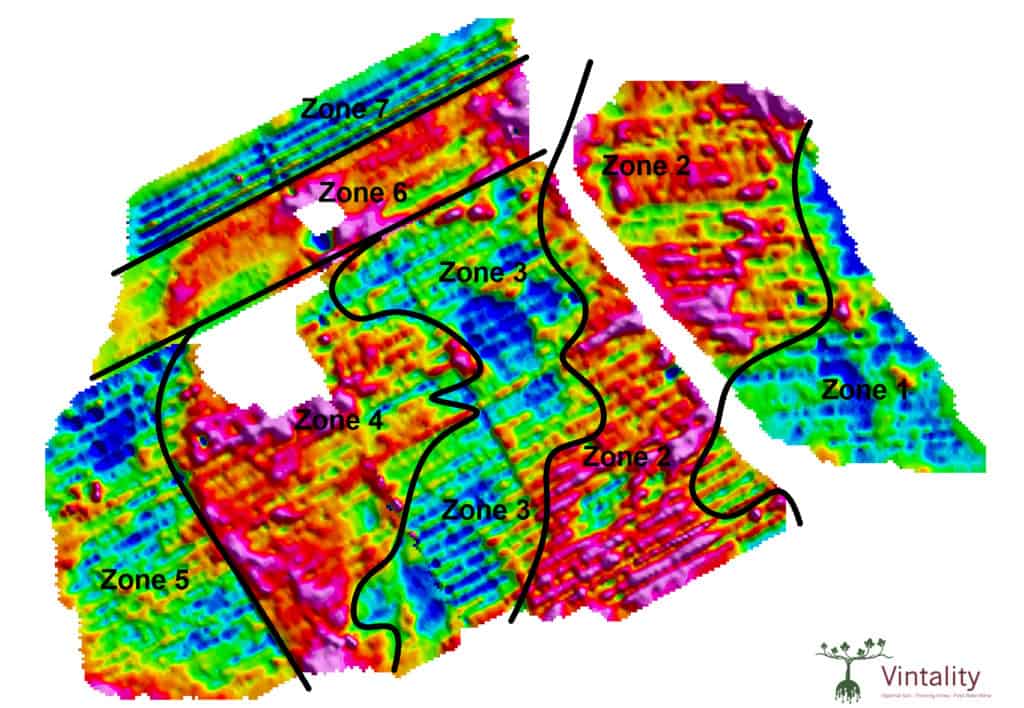
Seventh, we’ll compile all this information and form soil “zones”. These are areas that have similar characteristics and are likely a single (or related) soil type and will be confirmed via ground truthing. These are areas that the vineyard will want to irrigate uniquely. As you can see in the example below you won’t irrigate precisely to these zones (because it’s not practical). But it will serve as a guide (and allow you to understand differences in vineyard behavior where a zone isn’t being irrigated to its ideal water threshold).
tl;dr – Summary of how to interpret an EC map:
1. When you first look at the map remember that the highs/lows aren’t absolute but are relative within the vineyard.
2. Take information you have on the vineyard (eg. visual observations on soil) and use it to begin interpreting features in the map.
3. If other sampling/surveying has been done, correlate that with the map to look for common factors. For example, if higher CEC correlates with EC highs, clay is likely a driving factor.
4. Now start looking more specifically for differences between the 0.75 and 1.5m map. Where are the transition points? Do they transition from high>low or low>high?
5. Interpret the map topographically. Where are there correlations between EC highs and topographical lows?
6. Are there any distinctive features within the grid itself? Are there areas where EC highs/lows have a different appearance than others?
7. Where do you see similar soil behaviors? Where would you draw soil zones?
What is ground truthing?
So you’ve got your EC results and have interpreted them. You’ve identified features, different soil zones, and probable causative factors. Now what?
The first stage is ground truthing. This is an absolutely necessary stage in running an EC survey. It’s what takes our above ground analysis and confirms it (or changes it) with below ground “truth”.
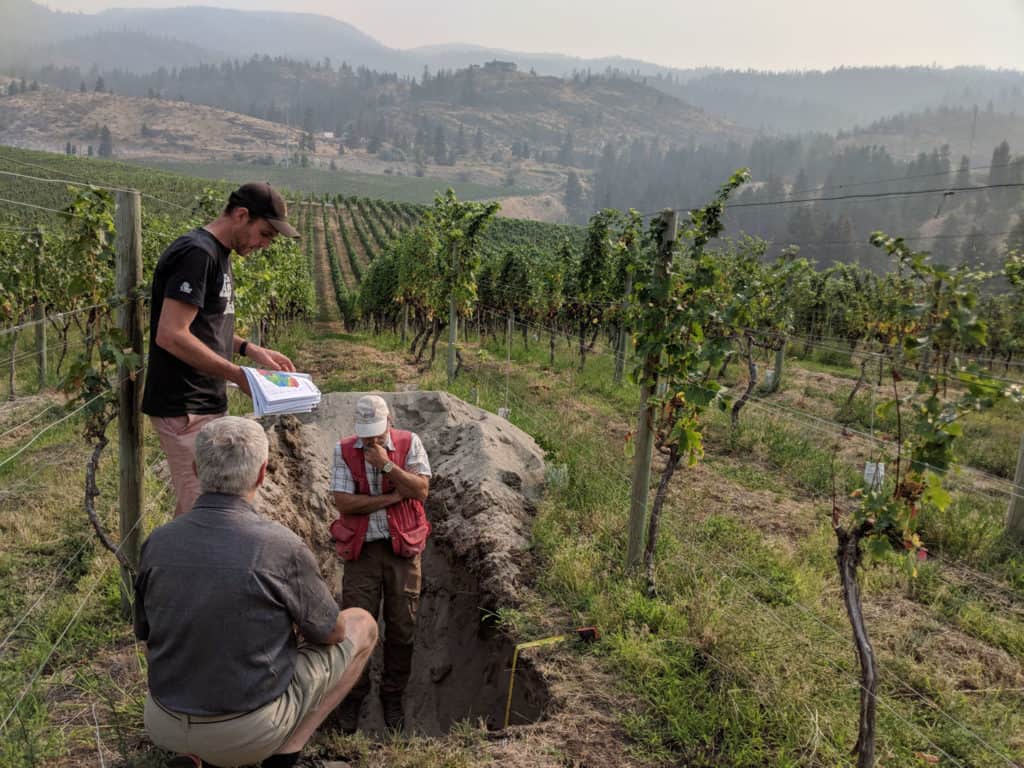
The standard approach, and very much recommended, is to dig soil pits close to the roots. Typically, you’ll want to dig at each transition area as well as within each EC zone (ideally around the highest highs and lowest lows within each zone). This is of course also informed by information about the vineyard. If you have an area that is completely sand and it’s a conductive low at both depths, there’s less of a need to dig a soil pit.
In terms of depth, you’ll want to get to at least 1m (if possible). Ideal is getting closer to 1.5m but this isn’t always feasible. From here, it’s about making visual observations and field texturing. You’re trying to answer the question: why is this area a high/low? If it shows a transition – why are we seeing a transition at depth? How deep are the roots going, are they diving down or spreading more horizontally? This is a critical stage that either confirms the analysis or requires it to be re-visited. And we want soil pits in different zones because we can have different explanations – the initial analysis can be correct on 6/8 zones but have other driving factors in the other 2.
It is possible to ground truth via augering or coring, but this isn’t recommended. The information gathered is inferior to a soil pit, particularly in being able to observe soil structure and make detailed observations by observing the whole soil profile. In some cases, augering is the only feasible option. What this will tell you is the type of soil at different depths and will help calibrate the EC survey. Augering does have a use as a reconnaissance tool to quickly make decisions in calibrating the EC survey.
What do you do with this information?
Now you’ve mapped your soil, have soil zones, and made other observations about your soil structure. Now what? The information is only good if you can use it.
The primary use of EC is in determining the best methods and schedules of irrigation for your vineyard. There are more uses (discussed below) but this is the big one. An EC survey should be able to tell you how to irrigate and what results to expect. Speaking broadly: sandy soil, more frequent and shorter duration to keep in the root zone; clay overtop of loam, less frequent but longer duration to penetrate past that clay, etc. If your soil is holding water high up or low down in the soil profile can seriously affect how you irrigate. This is of course very general, but gives you a rough idea what to expect.
It’s also very useful for pre-planting analysis in planning out how to structure your irrigation and what type of irrigation to use. Just like doing soil analysis, this is an important tool that will save you a lot of headache and money in the long run.
I plan on writing another blog going into more detail about how to apply EC results and what you can do with them (such as determining soil sampling locations).
What else can an EC survey tell you?
EC surveying is very well supported in vineyard practice and within the scientific literature. Because of this, we have excellent information on other results from EC surveying.
I’m going to list them with brief comment. They are:
- Salinity
- EC surveys are frequently used to determine soil salinity. In areas with high rainfall that do not use particularly saline water, this is not a concern.
- Cation Exchange Capacity
- This is the strongest, most well-supported variable. Because clay is tied so strongly to water content, it’s intuitive that relatively higher clay content will show up in EC.
- Organic Matter
- Nitrogen
- EC surveys have been able to distinguish between synthetic and manure fertilisers. It appears that the EC is picking up the decomposition of water-soluble N and can give an indication of bioavailable N. Rather than give total available N it gives an indication of differences within the property.
- Nutrients
- When heavily saturated,
- Elements
- Anions
- Phylloxera
- EC surveys are often used to determine where to place phylloxera traps. There is a high correlation between high EC readings and desirable feeding sites for phylloxera. In cases where phylloxera have been present for some time, this is less useful as they will have used up their ideal sites and moved onto other areas within the vineyard.
Conclusion
You should have a good idea now how an electrical conductivity survey is run, some of the science behind it, and what the benefits are. Perhaps most immediately: how to read an EC map. It’s a neat party trick (it’s really not).
Any questions or comments, say so below or email me at chris(at)vintality.ca. If you’d like to discuss running an EC survey on your property, you can reach me at the same spot.